Integrated infrastructure

Compare infrastructure choices with simulation tools and validators. Inspect the assumptions, run the code and check the results.

Infrastructure tools

Each tool addresses a specific decision. Source figures and explanations are under Technical evidence.

GPU Cluster Networking

Training workers wait when they cannot exchange results quickly enough. Compare communication costs and workload placement in a modeled GPU cluster.

Technical evidence

How to read this chart. Start with the left chart: lower lines mean less time to finish a training step. A value of 1 means the same time as running inside one compute hall. Solid lines keep communicating workers grouped together; dashed lines interleave them between halls. The right chart shows how adding more participants to a communication ring can increase the delay in the modeled case.
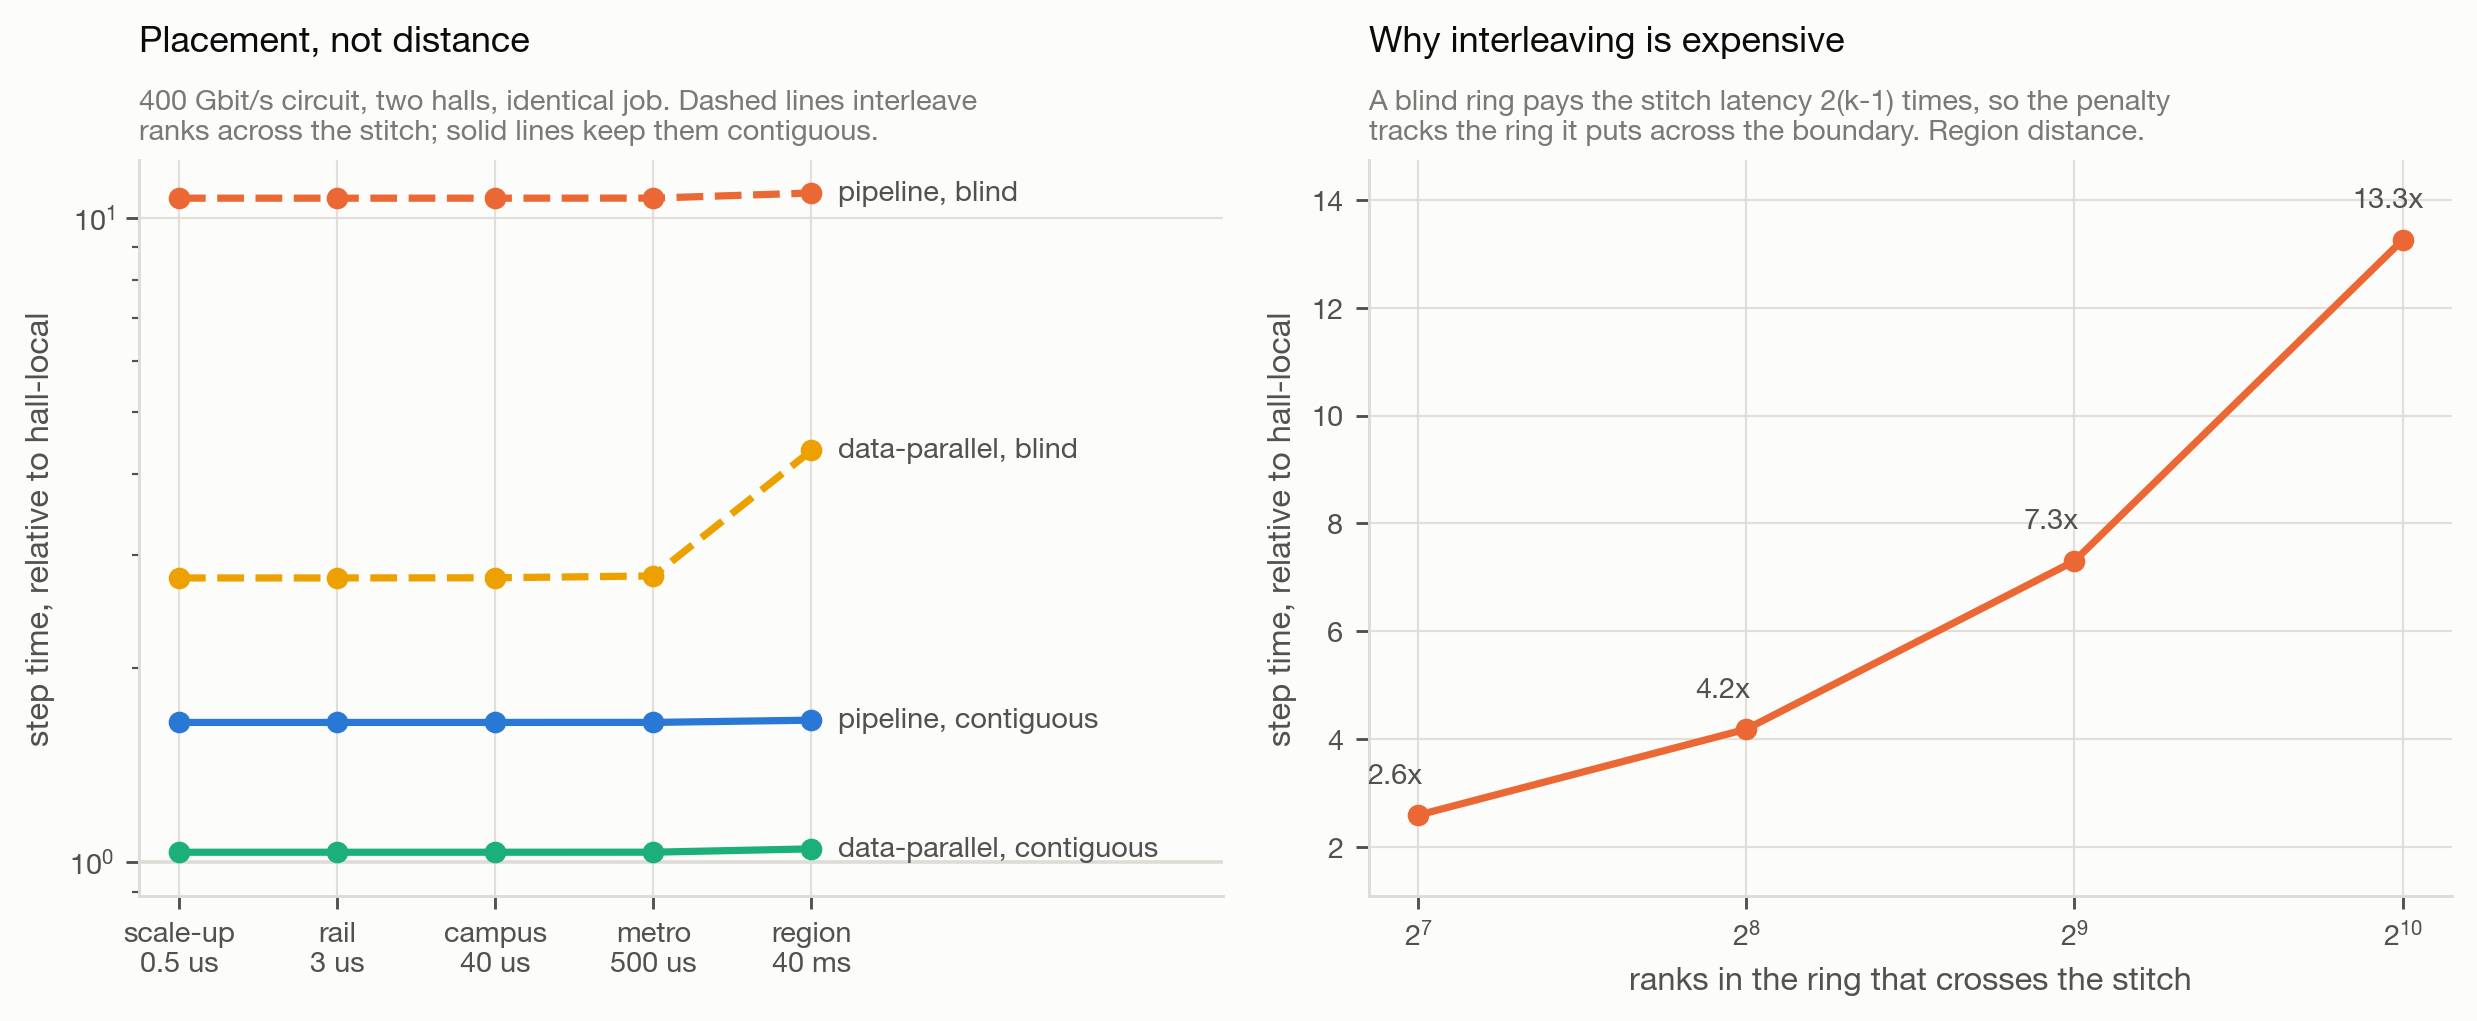
Modeled training comparison. Two halls and a 400 Gbit/s circuit. Step time is relative to hall-local execution; rank placement and ring size vary.
Modeled training comparison. Two halls and a 400 Gbit/s circuit. Step time is relative to hall-local execution; rank placement and ring size vary.Full-size figure ↗Source figureMethod

GPU Cluster Scheduling paper

Compare how scheduling policies use the same GPU pool under power limits, failures and changing demand.

Technical evidence

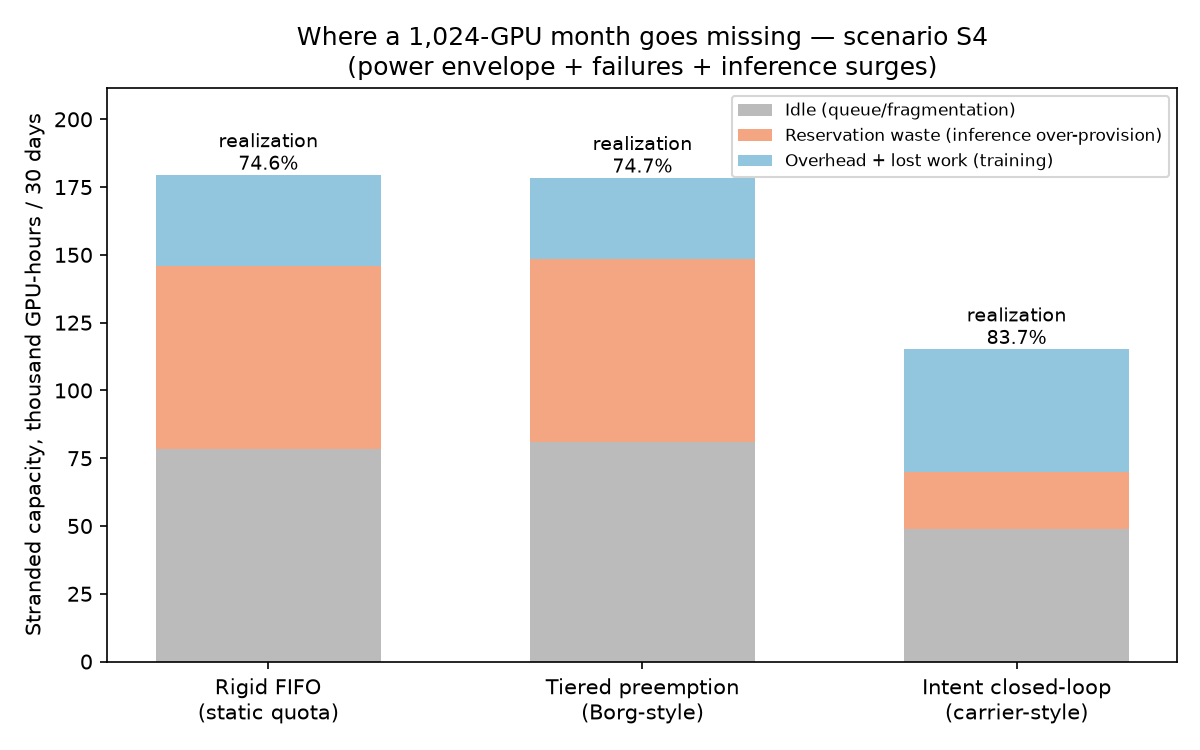
How to read this chart. Each bar represents a different rule for sharing the same processor pool. A shorter bar means less capacity left unused or lost. The colored sections separate idle time, unused reservations, and training overhead or lost work. The percentages above the bars show how much of the available capacity the simulated policy turns into productive work.

Simulated scenario S4. 1,024 GPUs over 30 days, with power constraints, failures and inference surges. Reservation tracking and elasticity change together.
Simulated scenario S4. 1,024 GPUs over 30 days, with power constraints, failures and inference surges. Reservation tracking and elasticity change together.Full-size figure ↗Source figureMethod

Chaos Fidelity Standard standard · pip

Check whether a failure experiment tests the part of the system it claims to test.

pip install ai-cluster-chaos-fidelity
chaos-fidelity my-experiment.yaml

Reliability Economics

Compare the cost of saving checkpoints with the work lost after failures, including spare capacity and recovery choices.

Technical evidence

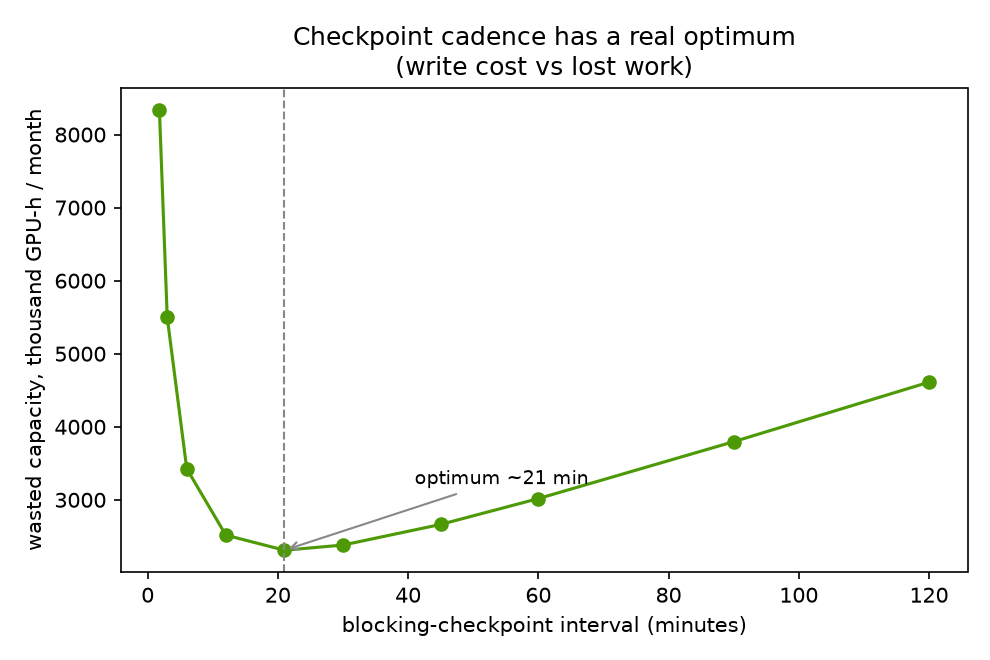
How to read this chart. Read from left to right as the time between saves increases. The vertical axis shows wasted processor-hours over a month; lower is better. The low point marks the best interval among those tested in this simulation. It is not a recommended save interval for every training job.

Simulated checkpoint sweep. 16,384 GPUs over 30 days, with 16 spare nodes. The displayed optimum applies to this failure model and checkpoint policy.
Simulated checkpoint sweep. 16,384 GPUs over 30 days, with 16 spare nodes. The displayed optimum applies to this failure model and checkpoint policy.Full-size figure ↗Source figureMethod

Governed Autonomy pip

Check evidence and independent approval before increasing software control over infrastructure. This tool evaluates records; it does not execute changes.

pip install governed-autonomy-gate
promotion-gate my-record.yaml

Compute↔Power Placement

Compare keeping a workload in place, splitting it between sites or moving it. Account for power costs, available capacity, communication and deadlines.

Technical evidence

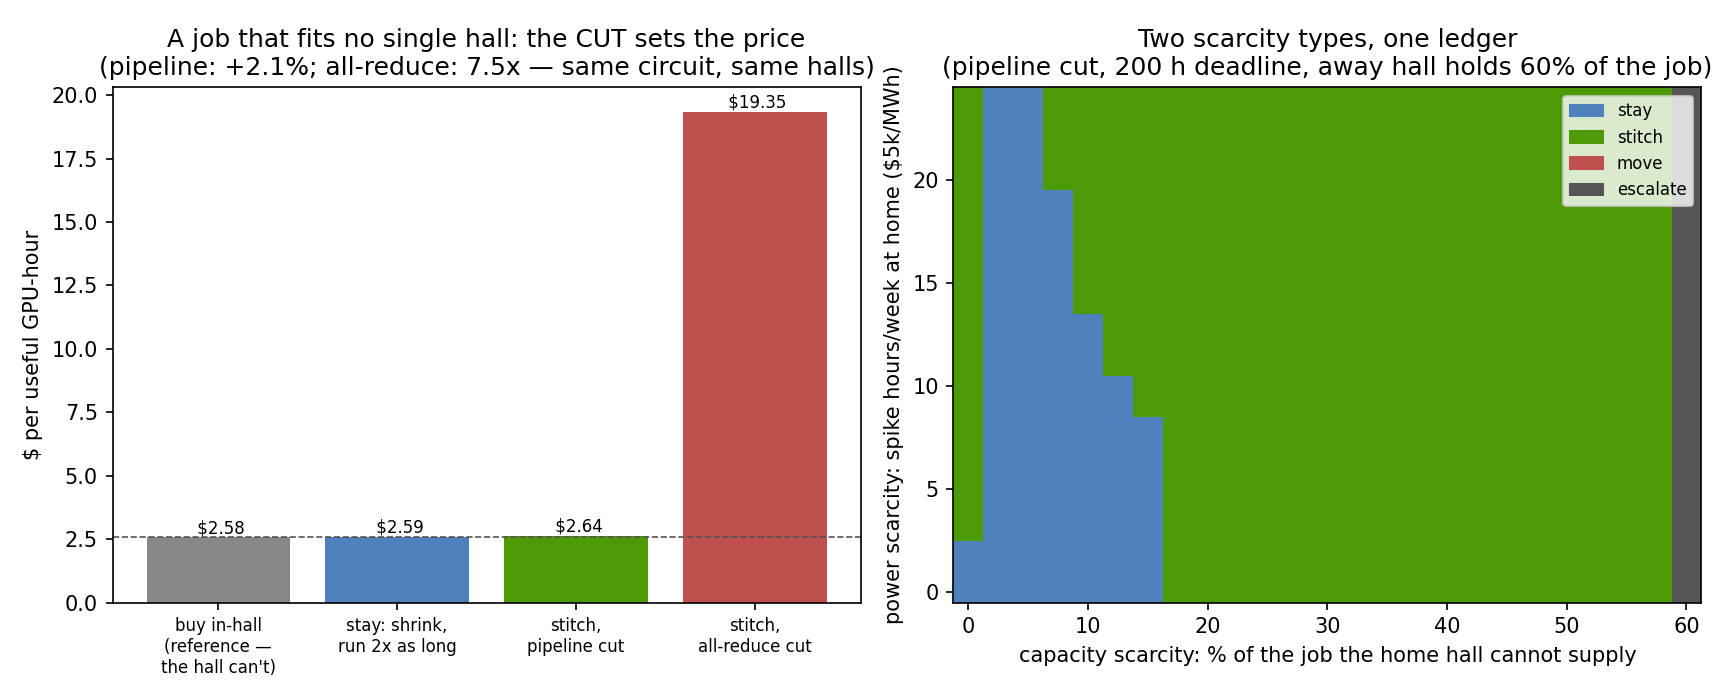
How to read this chart. The left chart compares modeled dollars per useful processor-hour; lower bars cost less. Splitting work between sites has different costs depending on how the parts communicate. On the right, each colored area shows the model’s choice as shortages of machines and expensive-power hours change. Those choices depend on the scenario below.

Modeled placement comparison. The right-hand scenario uses a 200-hour deadline and an away hall holding 60% of the job. Costs and decisions depend on these inputs.
Modeled placement comparison. The right-hand scenario uses a 200-hour deadline and an away hall holding 60% of the job. Costs and decisions depend on these inputs.Full-size figure ↗Source figureMethod

Edge↔Neocloud Placement pip

Check which locations meet a workload’s stated network, power, latency and data-location requirements.

Technical evidence

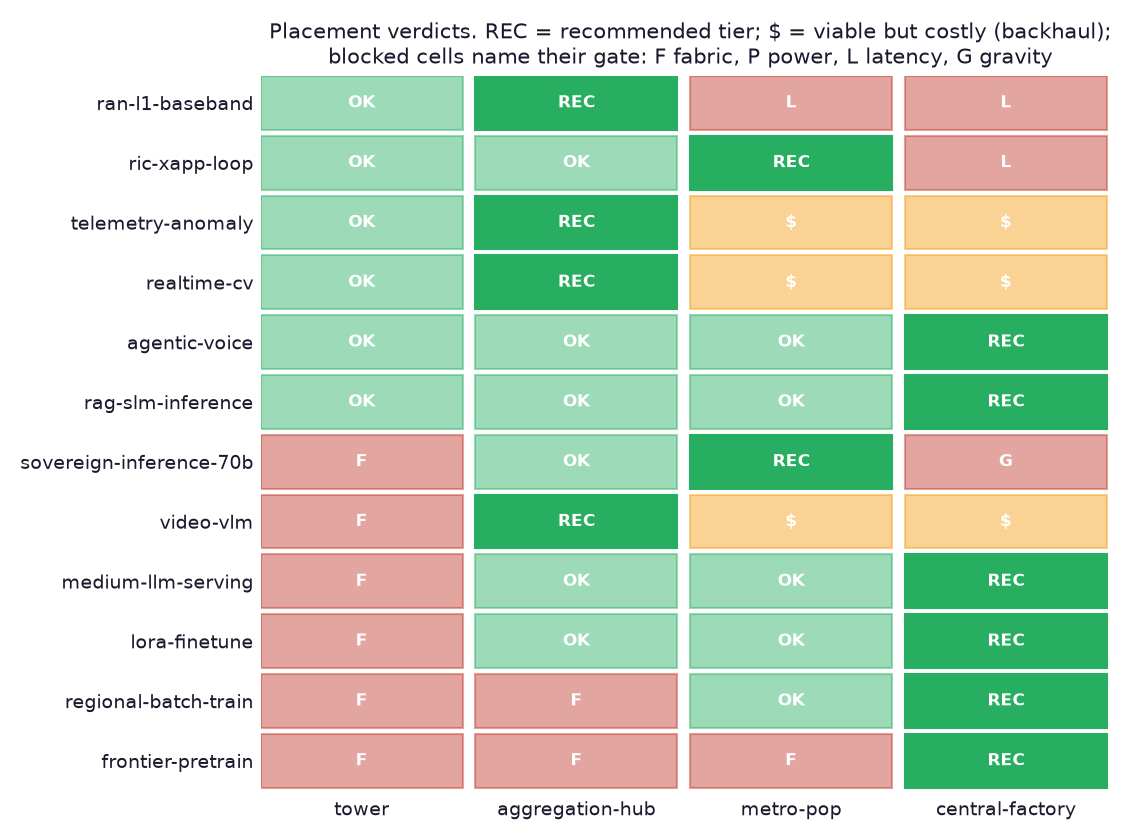
How to read this chart. Each row is a type of AI job. Columns move from a small local site to a central facility. REC marks the model’s recommended location; OK means it meets the requirements. A dollar sign flags added backhaul cost, the cost of carrying data to another site. Blocked cells name the failed check: F network, P power, L response time or G data location.

Declared-profile evaluation. Twelve workload profiles evaluated against four tier envelopes. Letters identify the constraint that blocks a placement.
Declared-profile evaluation. Twelve workload profiles evaluated against four tier envelopes. Letters identify the constraint that blocks a placement.Full-size figure ↗Source figureMethod
pip install edge-continuum-placement
edge-placement evaluate -w frontier-pretrain -t tower  # exit 1

AI-RAN ↔ Neocloud Resiliency pip

Compare simulated downtime under different power, connectivity and timing failures, with alternative resilience measures.

Technical evidence

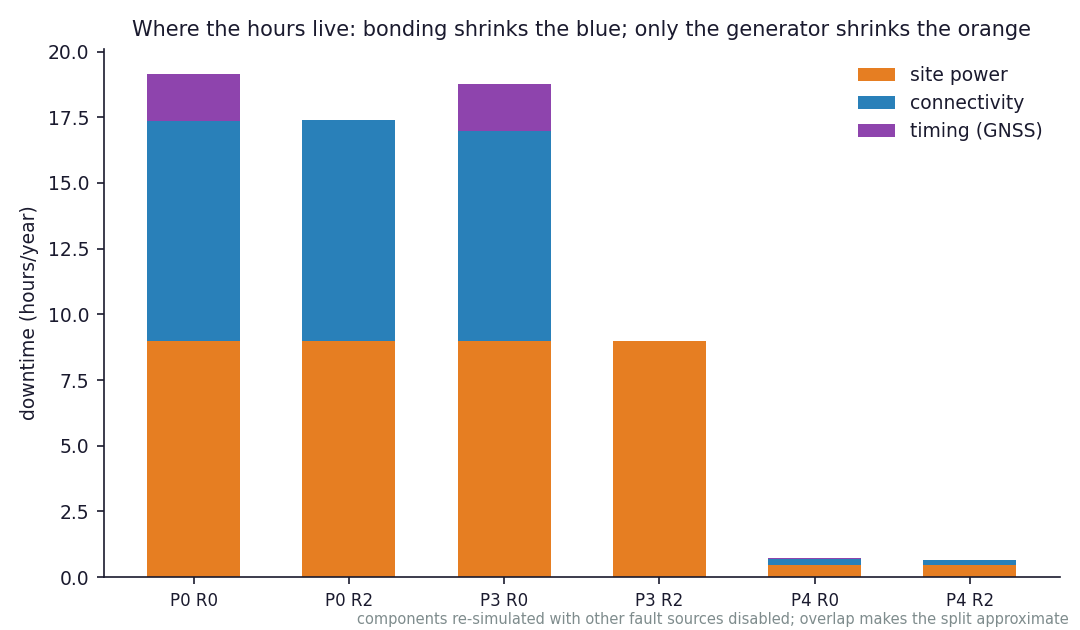
How to read this chart. Each bar shows simulated downtime in hours per year; shorter is better. Orange is power loss, blue is lost connectivity and purple is lost timing. P0 uses one fiber connection. P3 adds backup connections; P4 also adds a generator, a more resilient clock and local control. R0 is radio traffic; R2 is tenant AI traffic. Compare the same class between packages: a smaller blue section does not necessarily reduce the orange one.

Simulated downtime breakdown. 2,000 simulated years per policy, seed 7. Fault sources are isolated in separate runs; overlapping failures make the split approximate.
Simulated downtime breakdown. 2,000 simulated years per policy, seed 7. Fault sources are isolated in separate runs; overlapping failures make the split approximate.Full-size figure ↗Source figureMethod
pip install airan-neocloud-resiliency
airan-resiliency ladder

Cooling & the PUE Ladder pip

Compare cooling options, rack power limits and facility power overhead under declared conditions.

Technical evidence

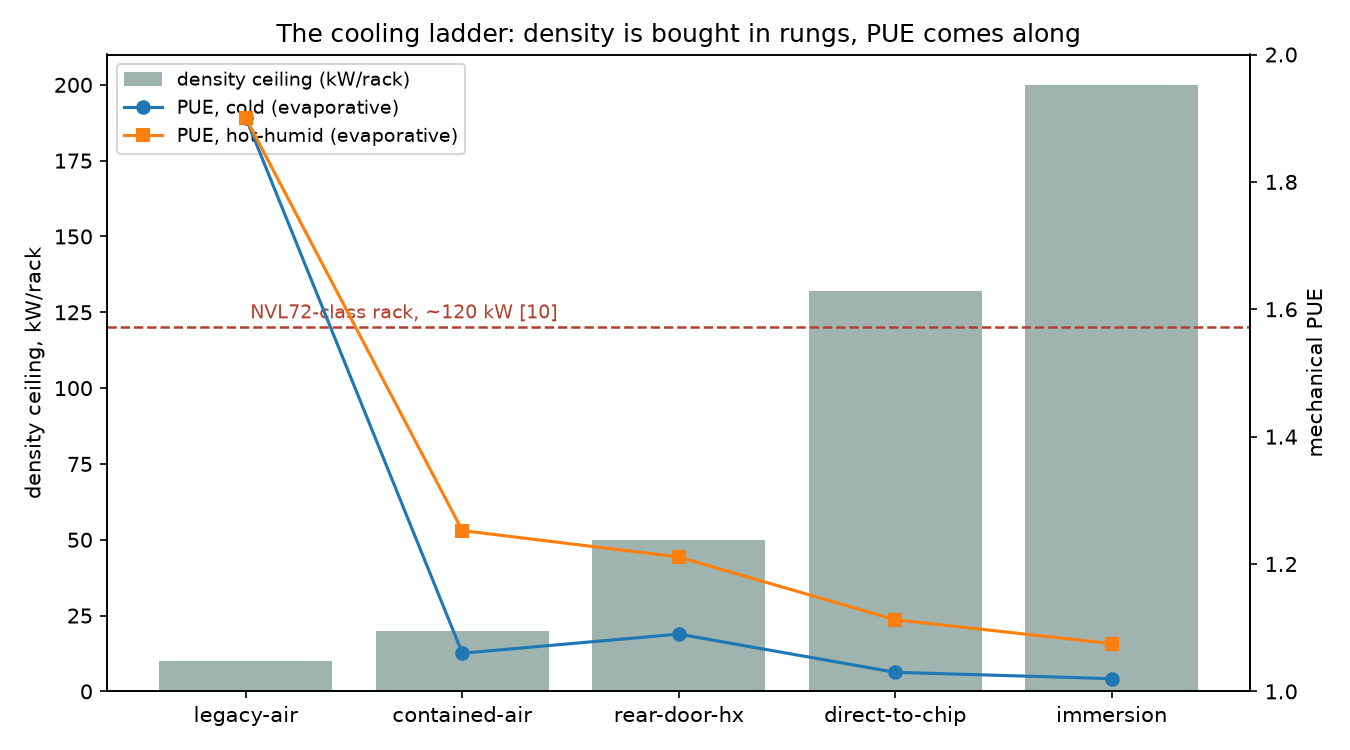
How to read this chart. Bars use the left axis: taller bars mean the assumed cooling system can support more power per rack. Lines use the right axis and show PUE, total facility power divided by power used by computing equipment. Closer to 1 means less overhead. The two lines compare climates; they are modeled conditions, not measured sites.

Modeled cooling comparison. Declared density ceilings and evaporative-cooling assumptions for cold and hot-humid conditions. These are model inputs and outputs, not a measured fleet.
Modeled cooling comparison. Declared density ceilings and evaporative-cooling assumptions for cold and hot-humid conditions. These are model inputs and outputs, not a measured fleet.Full-size figure ↗Source figureMethod
pip install cooling-pue-ladder
pue-ladder gate --density 120 --rung contained-air  # exit 1

The Span Admission Contract scale-across · pip

Check a proposed workload against declared network constraints. The result includes missing evidence alongside the decision.

pip install span-contract
spancontract validate envelope.json

Optical Circuit Intent scale-across · pip

Check a proposed optical-circuit change against network limits and workload timing requirements. The tool does not change the network.

pip install optical-circuit-intent
ocintent ladder

Slice-Packing a Torus Pod scale-across · pip

Explore how failures and maintenance affect connected allocations in a torus network, whose opposite edges connect.

pip install slice-packer-torus
slicepacker cordon --shape 16,16,16

Inspect the evidence

The joined-capacity model has an evidence manifest recording assumptions, sources and scope. It distinguishes scenario choices from empirical measurements.

Discuss your infrastructure

Tell us about your workload, network constraint or placement decision. Contact DIMAGGI AI.